Use it
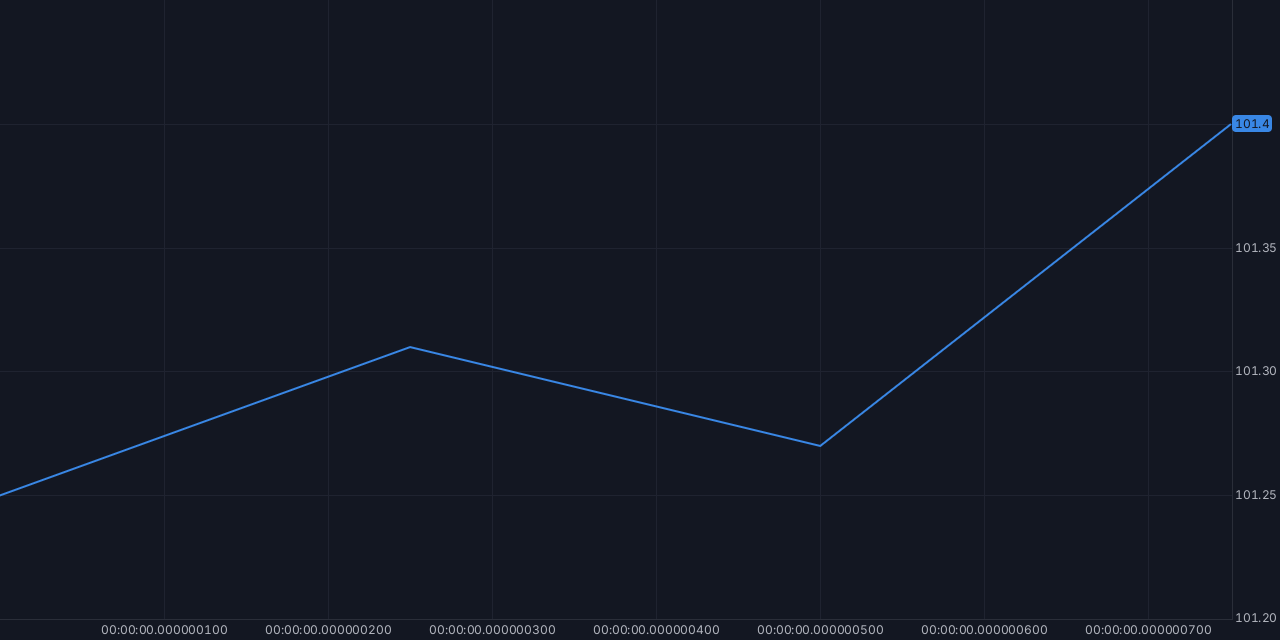
A point is a time in nanoseconds, a value and a weight. A value is an integer
of a fixed number of decimal places, so 101.25 stays
101.25 from your data to the frame.
The guides take a task from start to end: choosing
between a file, tiles and a live feed, getting your data in, choosing the pyramid,
serving, and drawing in a browser, in .NET, from C or as an image.
Your own data: a CSV, with no code
nonius-server csv prices.csv prices.nsb
It comes with cargo install nonius-server. It finds the decimal places,
reads ISO 8601 times and a spreadsheet's semicolons and decimal commas, and stops at the
first line it cannot read, saying which. nonius-server prices.nsb then
serves the file.
From a program, the same file comes from each package, byte for byte: Rust's
write_series, .NET's Nsb.Encode, C's
nonius_nsb_write, and encodeNsb in JavaScript, in the
browser or in Node.
Rust: a series file to a picture, with no GPU
cargo add nonius-format nonius-core
cargo add nonius-render --no-default-features
Read the file in place, keep it as a pyramid of summaries, and draw any view
of it, here the whole series:
use nonius_core::{Loaded, Pyramid, Series, Width, Zone};
use nonius_format::{AlignedBytes, Container};
use nonius_render::{Still, Theme, still_png};

fn main() -> Result<(), Box<dyn std::error::Error>> {
    // Read once into memory aligned for the columns, then read in place.
    let bytes = AlignedBytes::from_slice(&std::fs::read("day.nsb")?);
    let container = Container::parse_checked(bytes.as_slice())?;
    let series = Series::from_container(&container)?;

    // Summaries from one second up, nine levels (see nonius-core's
    // "Choosing the pyramid").
    let mut pyramid = Pyramid::new(Width::new(1_000_000_000)?, 9)?;
    pyramid.extend_sorted(series.iter())?;
    let loaded = Loaded::new(&pyramid, (series.t(), series.v(), series.w()));

    let (Some(&first), Some(&last)) = (series.t().first(), series.t().last()) else {
        return Err("the file holds no points".into());
    };
    // The image's size is in device pixels; `ratio` scales labels and lines.
    let png = still_png(&loaded, &Still {
        start: first,
        end: last + 1,
        width: 2400,
        height: 800,
        theme: Theme::light(),
        ratio: 2.0,
        scale: series.scale(),
        gap: None,
        zone: Zone::UTC,
        title: None,
        unit: None,
    })?;
    std::fs::write("day.png", png)?;
    Ok(())
}
An image says where its plot is and what it spans, so a click on it picks the exact
point and a mark drawn over it lands where the line is: the server's /png
answers Nonius-Plot and Nonius-Range, and
still_placement, C's nonius_still_placement and .NET's
Series.StillPlacement give the same numbers.
The browser: a chart a person can pan and zoom
npm install nonius
const chart = await createChart(canvas);

// Your points: times in nanoseconds since 1970 as BigInts, values as
// integers with a fixed number of decimal places (2 here: 10_000 is
// 100.00), and a weight each.
const { t, v, w } = randomWalk();
chart.setScale(2);
chart.push(t, v, w);

// Open on everything, the value axis fitted to it.
const [start, end] = [t[0], t[t.length - 1] + 1n];
const [lo, hi] = chart.autoscale(start, end, 0, 8);
chart.setView(start, end, lo, hi);
WebGPU where the browser has it, WebGL2 otherwise, and a 2D canvas when
neither gives a device. The package also follows a server's tiles and streams
a live feed from a worker; React and Vue use it as any other module.
A sensor that reports in bursts draws a straight line from one burst to the
next unless you say how long a pause is a gap: chart.setSeriesGap(id, ns)
breaks the line wherever a point comes more than ns nanoseconds after the
one before, in the same places at every zoom.
Time is labelled in UTC until you name a zone:
setTimeZone(chart, "Europe/Lisbon") labels the axis, the crosshair and
the tooltip in its local time, on both sides of each daylight-saving change, from
the browser's own time zone data. The server's images take tz=, and the
.NET chart a TimeZoneInfo.
A title and a unit go on the chart itself, not in the page around it:
createChart(canvas, { title: "Room temperature", unit: "°C" }) draws a
header row above the plot, the title on the left and the unit over the value labels,
so a PNG sent by e-mail or a .NET desktop chart says what it shows. Labels draw
Latin-1 — every accent of Portuguese, Spanish, French and German — and a few marks
such as € and “ ”. The server's images take title= and unit=,
and the .NET chart Title and Unit.
.NET: the same core, from C#
dotnet add package Nonius
using var series = Series.FromNsb(File.ReadAllBytes(nsb));
if (!series.TryGetRange(out var first, out var last))
{
    throw new InvalidDataException($"{nsb} holds no points");
}
// Light, for a box of 1200 × 400 CSS pixels at a pixel ratio of 2:
// the size is in device pixels, the ratio in thousandths.
byte[] image = series.StillPng(new Still(first, last + 1, 2400, 800, Theme.Light, RatioPermille: 2000));
File.WriteAllBytes(png, image);
Nonius.Avalonia is a desktop chart control, and
Nonius.Blazor a component carrying the browser package.